Geospatial Sentiment Analysis
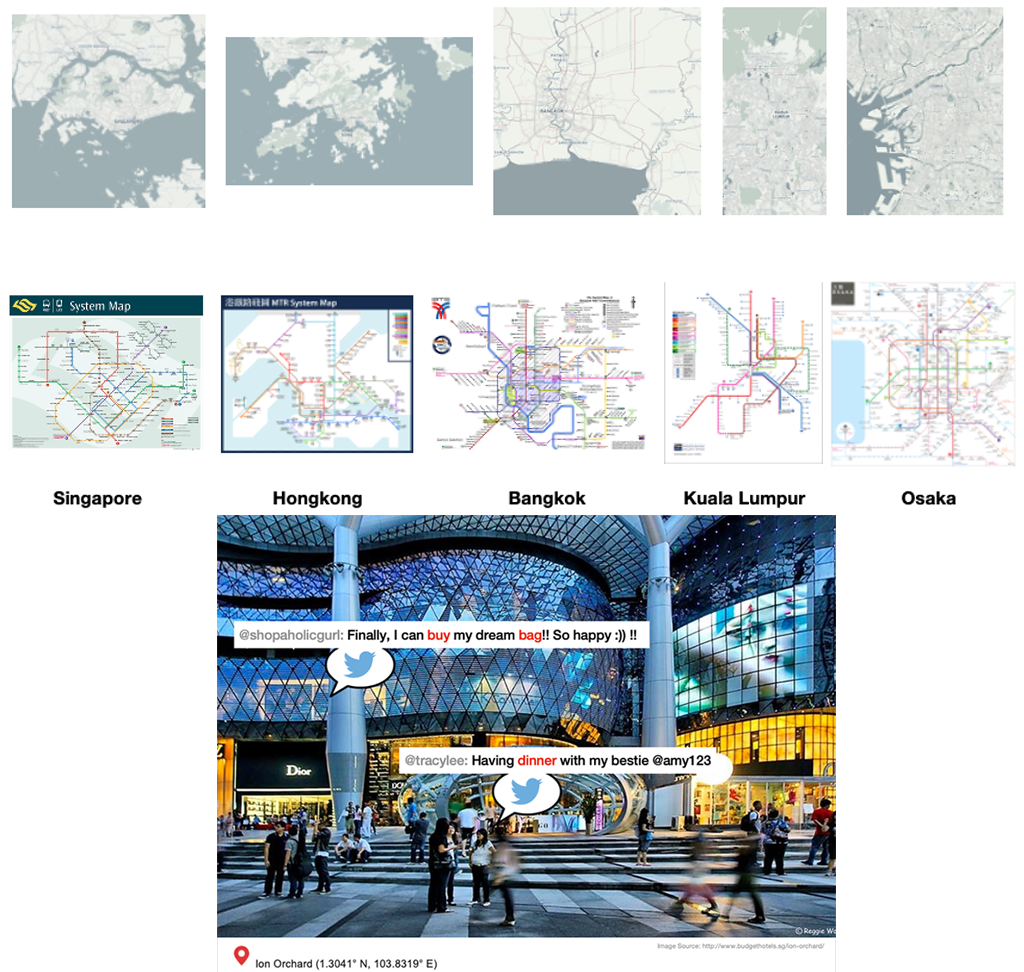

In this project, I was interested in exploring the relationship between social media data (X/Twitter) and its geospatial related data.
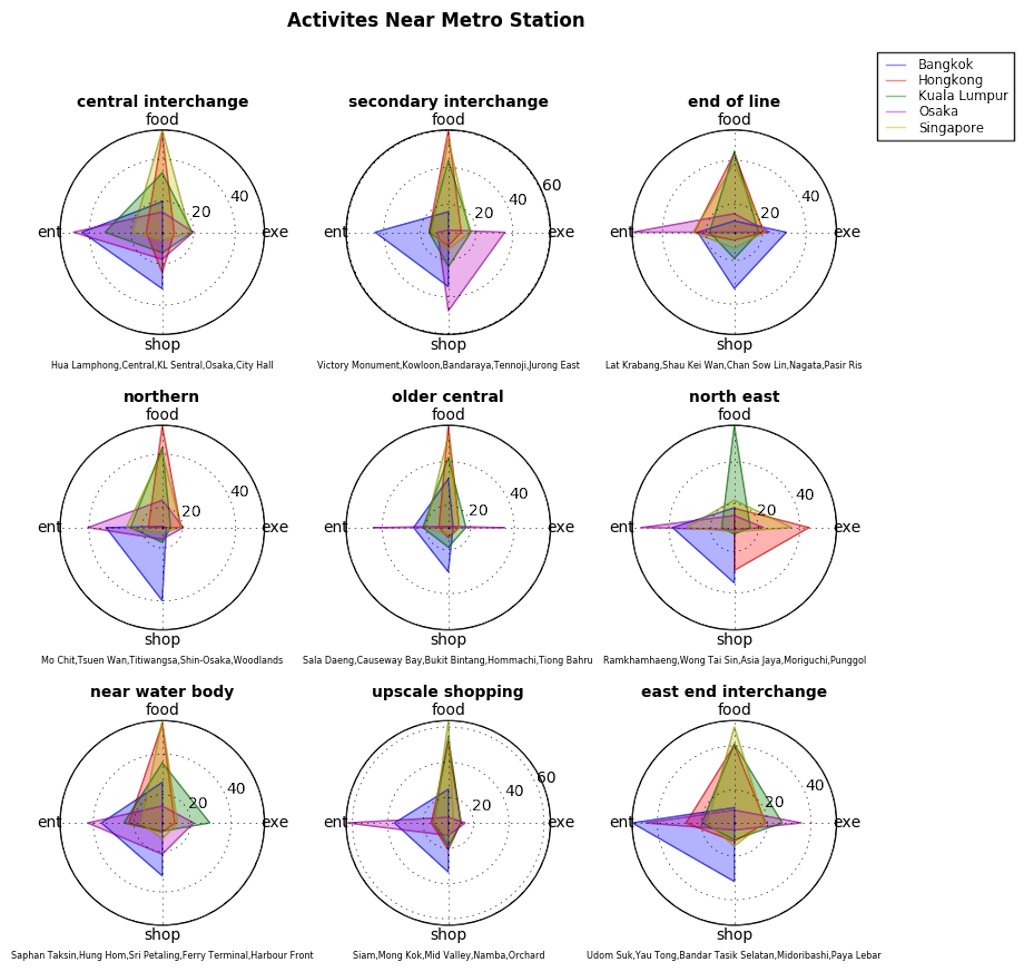
1. What are the types of activities happens around the metro stations? Are there any differences of these, around the major cities in Asia: Singapore, Hongkong, Bangkok, Kuala Lumpur, Osaka? Technology Stack: Jupyter Notebook for Python analysis with NLTK + ConceptNet to convert keywords to type of activities. Visualisation with Matplotlib.
Found the answer in the publication :
Cristie, V., Poorthuis, A., & Joyce, S.C. (2017). Connecting the dots – deriving insights into social behaviour around metro transport nodes through social media data in Singapore and beyond,
International Conference on Computers in Urban Planning and Urban Management, University of Southern Australia, Adelaide, Australia.
.
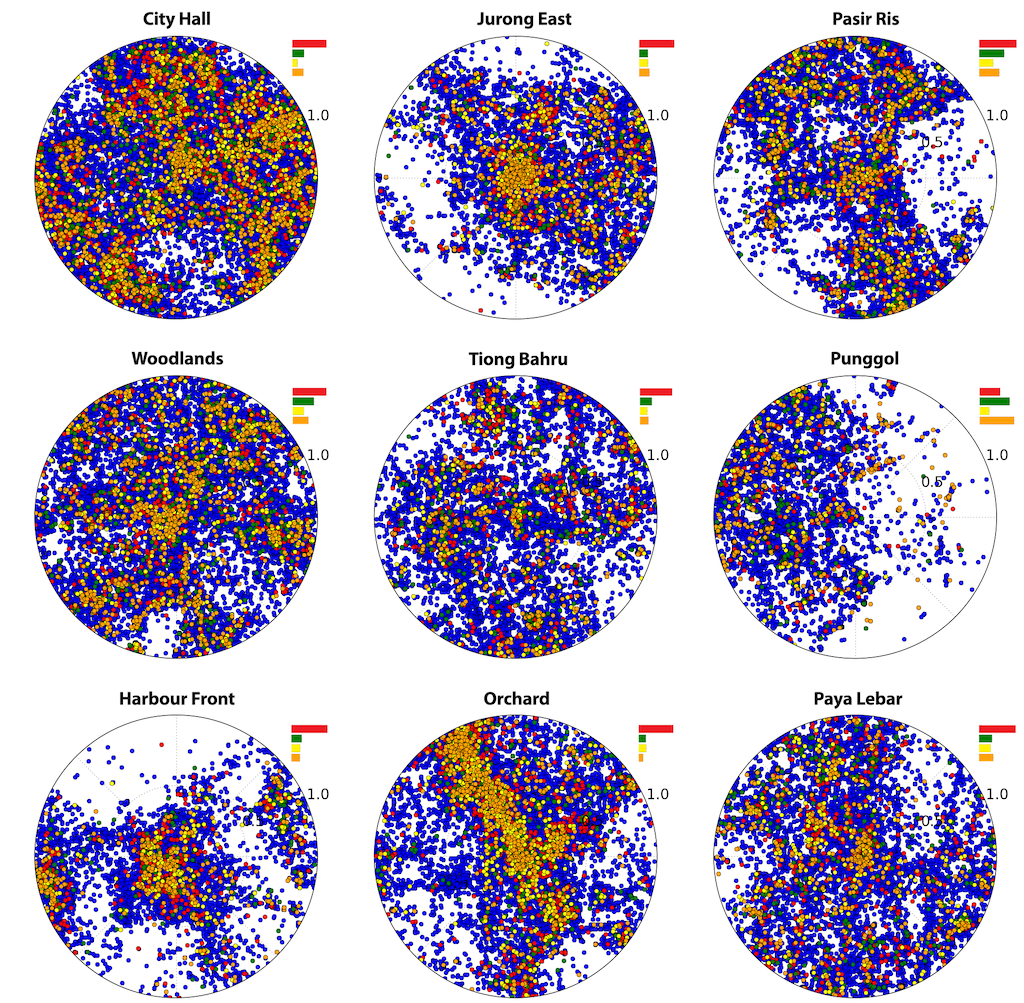
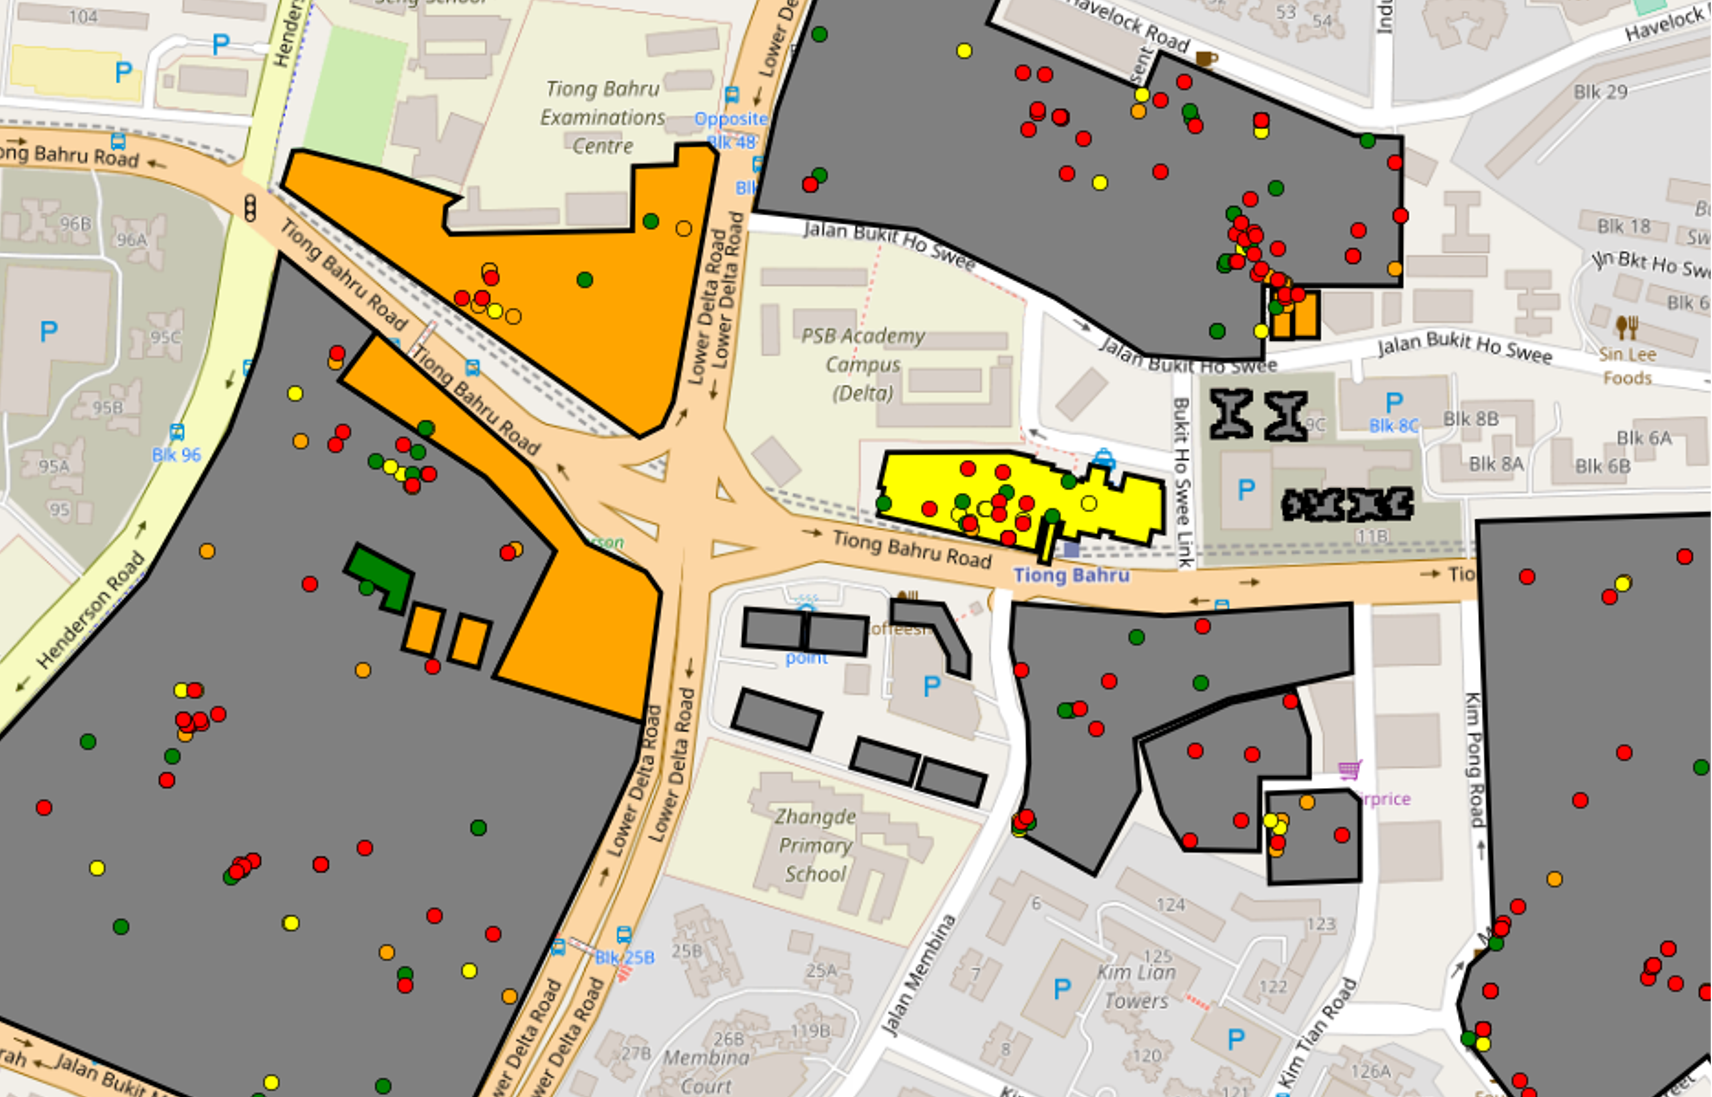
2. How does emotions (derived from Twitter's emoji) fare within the type and size of buildings?
This study is done within the context of Singapore, with the availability of the type and size of buildings data. Geopandas and Shapely (on top of Matplotlib) packages were used to process and visualise the data.
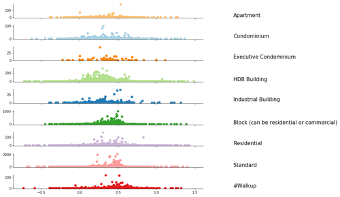
Matching tweet's geolocation data to buildings' perimeter, I calculated the 'emotion score' (based on Novak et al., 2015) of each building. After, I used the Self-Organising-Map to arrange the buildings based on the emotion, size, and type feature. Results showed that certain building types do have similarities in term of the emotions contained, and we could rank the emotions based on the type of buildings.
In the further analysis, features such as the building's amenities in the radius and its entropy were also included.